


Chart patterns are a very important technical aspect of day trading. Chart patterns help day traders visualize market psychology. They reveal where buyers are stepping in, where sellers are losing control, and where breakouts are likely to occur. When used with confirmation and proper risk management, chart patterns become powerful decision-making tools rather than random shapes on a chart.
In this guide, you'll learn the best chart patterns for day trading in 2026, how they form, how to trade them, and the mistakes that cause most traders to fail with them.
What Are Chart Patterns?
A chart pattern is a shape within a price chart that suggests to traders price movements. Studying chart patterns helps you learn the direction of prices in the past, which helps you determine how future prices will move.
Chart patterns work hand in hand with candlestick patterns, so traders can easily see the open and close of the market. You will find that some patterns are more suited to a volatile market, some are best in a bullish market, some are best in a bearish market, while some are simply bilateral.
Chart patterns serve three main purposes:
- Identify potential reversals
- Highlight breakout opportunities
- Define clear risk and reward levels
Types of chart patterns
Here are type of chart patterns you must know before choosing the best chart pattern:
- A continuation signal that indicates that a trend will continue
- Reversal chart patterns indicate that a trend will change direction
- Bilateral chart patterns mean the prices could move either way, and the market is volatile
There is no best chart pattern, as each of them highlights trends in their best possible way, depending on what you are looking for. But it is important you don't trade chart patterns blindly, instead learn to recognise patterns, know the one with the best win rate for your trades, and then confirm before placing your trades.
Related Read: 3 Main Types of Price Charts in Trading (And How to Read Them Like a Pro)
Best Bullish Chart Patterns for Day Trading
As a day trader, here are the chart patterns you should look out for. These patterns signal potential upward reversals or continuation moves.
Double Bottom
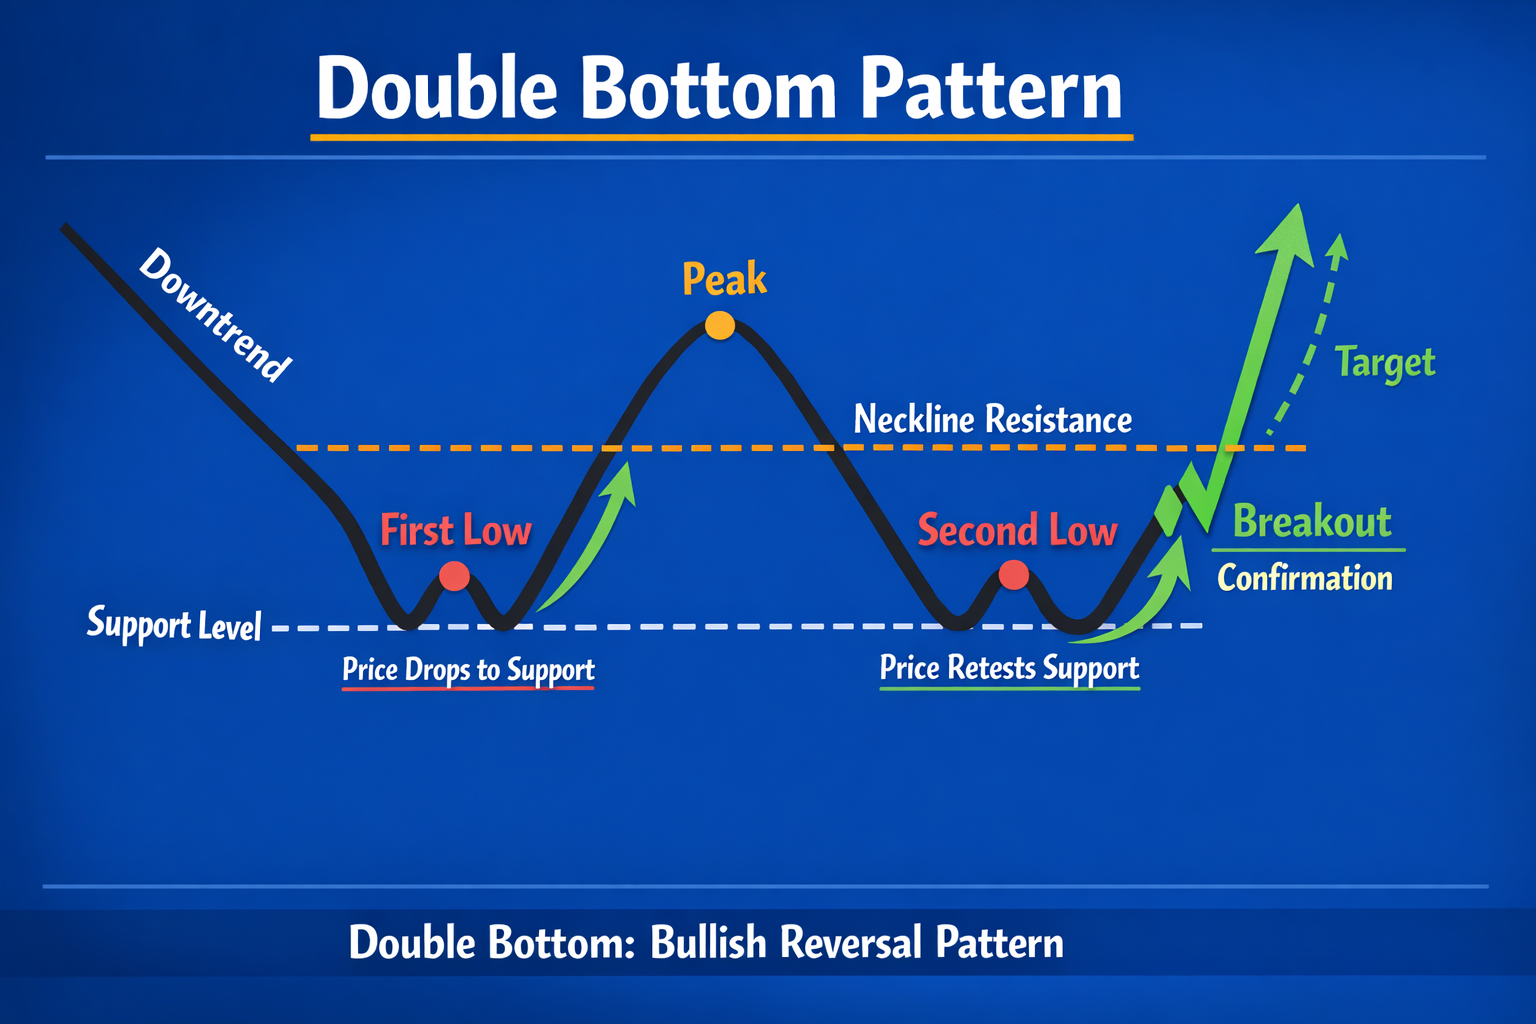
A double bottom is a classic bullish reversal pattern. It forms when the market price tests a support level twice, fails to break lower, and then breaks above resistance (the neckline). This movement creates a W-shape on the price chart.
The chart pattern is regarded as bullish because it signifies the end of selling pressure and a shift towards an uptrend, and if the market price breaks through the resistance level, it is likely to continue rising.
To trade this pattern effectively, wait for a clean break above the neckline before entering the position. You can choose to enter either on the initial breakout or on a retest of the neckline for confirmation. Place your stop-loss just below the second bottom to protect against downside risk, and set your profit target equal to the height of the pattern to maximize potential gains.
Also, always confirm the resistance level before you open your position, either by looking at past price action or using technical indicators.
Adam and Eve Pattern
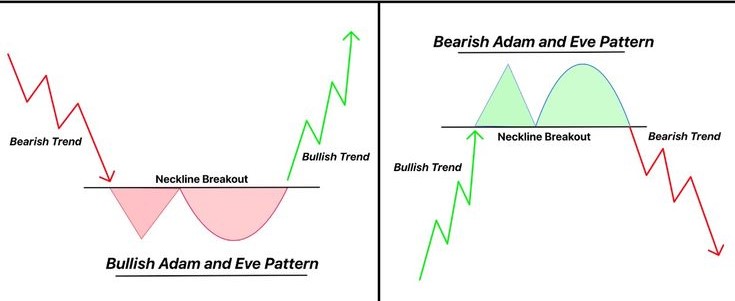
The Adam and Eve pattern is a variation of the classic double bottom. It forms when price creates two consecutive lows at roughly the same support level, but with different shapes and market emotions behind each bottom. The first bottom, known as Adam, is sharp, fast, and driven by panic selling. The second bottom, Eve, is slower, rounded, and signals stabilizing demand and accumulation. Together, they form a distinctive V-shaped drop followed by a smoother U-shaped recovery.
This pattern is considered a bullish reversal signal because it shows that aggressive selling has been exhausted and buyers are gradually regaining control. When price breaks above the neckline resistance, it confirms the shift from a downtrend into a new upward move.
To trade the Adam and Eve pattern effectively, wait for a clear breakout above the neckline. Conservative traders may wait for a retest of the neckline to confirm support before entering. A stop-loss is typically placed just below the second (Eve) bottom, while the profit target can be projected by measuring the height from the bottoms to the neckline and extending it upward.
This pattern works best after strong sell-offs, where emotional selling is followed by controlled accumulation. For added confirmation, look for expanding volume during the neckline breakout, as this signals strong buyer participation.
Rounding Bottom
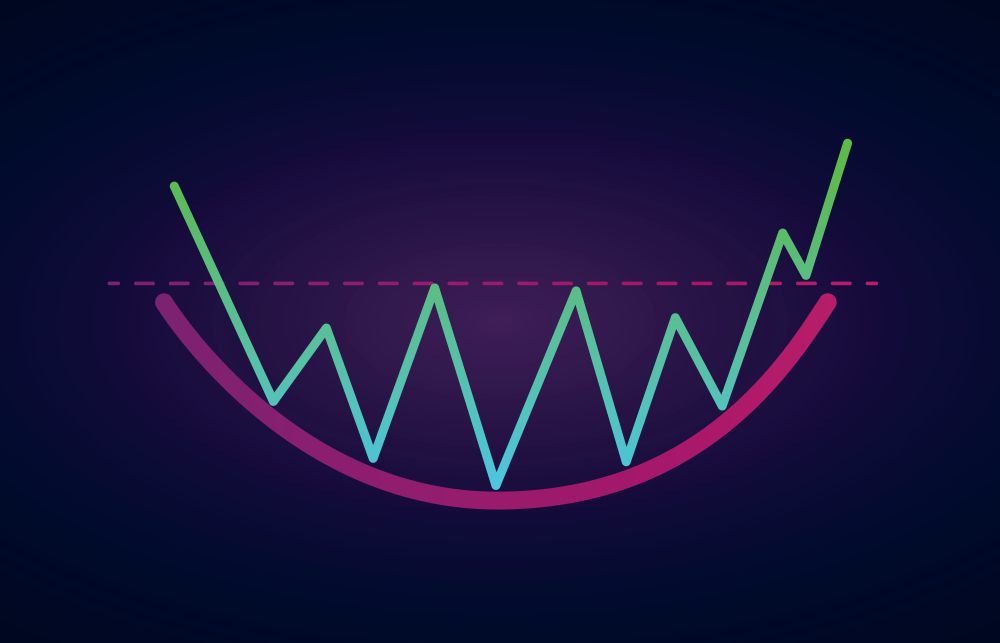
A rounding bottom is a bullish reversal pattern that forms when the price gradually transitions from selling pressure to buying control. Instead of a sharp V-shaped recovery, the market creates a smooth, curved base, showing that sellers are losing strength while buyers slowly accumulate positions. This patient shift in sentiment often precedes a strong breakout into a new uptrend.
The pattern is confirmed when the price breaks above the neckline resistance level. Until that breakout happens, the structure remains only a potential setup, which is why traders have to wait a little, as entering too early might be a mistake.
To trade the rounding bottom effectively, wait for a clean break above the neckline before entering a position. You can enter on the breakout itself or wait for a retest of the neckline to confirm it has flipped into support. Place your stop-loss below the lowest point of the rounded base to manage downside risk. For profit targets, measure the distance from the base of the pattern to the neckline and project that height upward from the breakout point.
Rounding bottoms work best after long consolidation periods, where steady accumulation builds the foundation for a breakout continuation. Always confirm the neckline using past price reactions or supporting technical indicators before committing to a trade.
Cup and Handle Pattern

A cup and handle is a bullish continuation pattern that forms during an existing uptrend. It develops when price creates a rounded bottom (the cup), followed by a brief consolidation or pullback (the handle), before breaking above resistance. This structure reflects a temporary pause in the trend, where sellers attempt to push prices lower, but buyers gradually regain control. The result is a strong breakout that often leads to trend continuation.
The pattern is considered bullish because it shows that selling pressure has been absorbed and demand is rebuilding. The small pullback that forms the handle represents the final attempt by sellers to dominate before price pushes higher.
To trade the cup and handle effectively, wait for a clean breakout above the resistance level at the top of the handle before entering a position. You can enter on the breakout itself or on a slight retest of the breakout level for confirmation. Place your stop-loss below the handle's low to protect against downside risk. To set a profit target, measure the height of the cup from its base to the resistance level and project that distance upward from the breakout point.
For best results, confirm the breakout with rising volume, as volume expansion signals strong buyer commitment and increases the reliability of the move.
Ascending Triangle Pattern

An ascending triangle is a bullish continuation chart pattern that forms when a rising trendline of higher lows meets a horizontal resistance level. In simple terms, sellers are defending a fixed price level, while buyers step in earlier on every pullback. This creates tightening price action and builds pressure for a breakout.
This pattern typically appears after an existing uptrend. During its formation, the market enters a brief consolidation phase where prices move within the triangle, and momentum temporarily slows. However, if price breaks and closes above the resistance line, it usually signals the continuation of the uptrend and the start of a fresh bullish move.
Volume plays an important role in confirming the setup. Trading activity often declines while the triangle is forming, reflecting market indecision. A sudden expansion in volume during the breakout adds confirmation that buyers are in control and increases the probability of follow-through.
To trade an ascending triangle effectively, wait for a clean breakout above resistance before entering. Conservative traders may wait for a retest of the broken resistance as new support. Place your stop-loss below the most recent higher low inside the triangle to manage risk. A common profit target is calculated by measuring the height of the triangle and projecting that distance upward from the breakout point.
Read More: How to Calculate Profit Trading: Simple Formulas and Examples (2026)
Best Bearish Chart Patterns for Day Trading
These signal potential downside reversals or continuation moves.
Double Top Chart Pattern
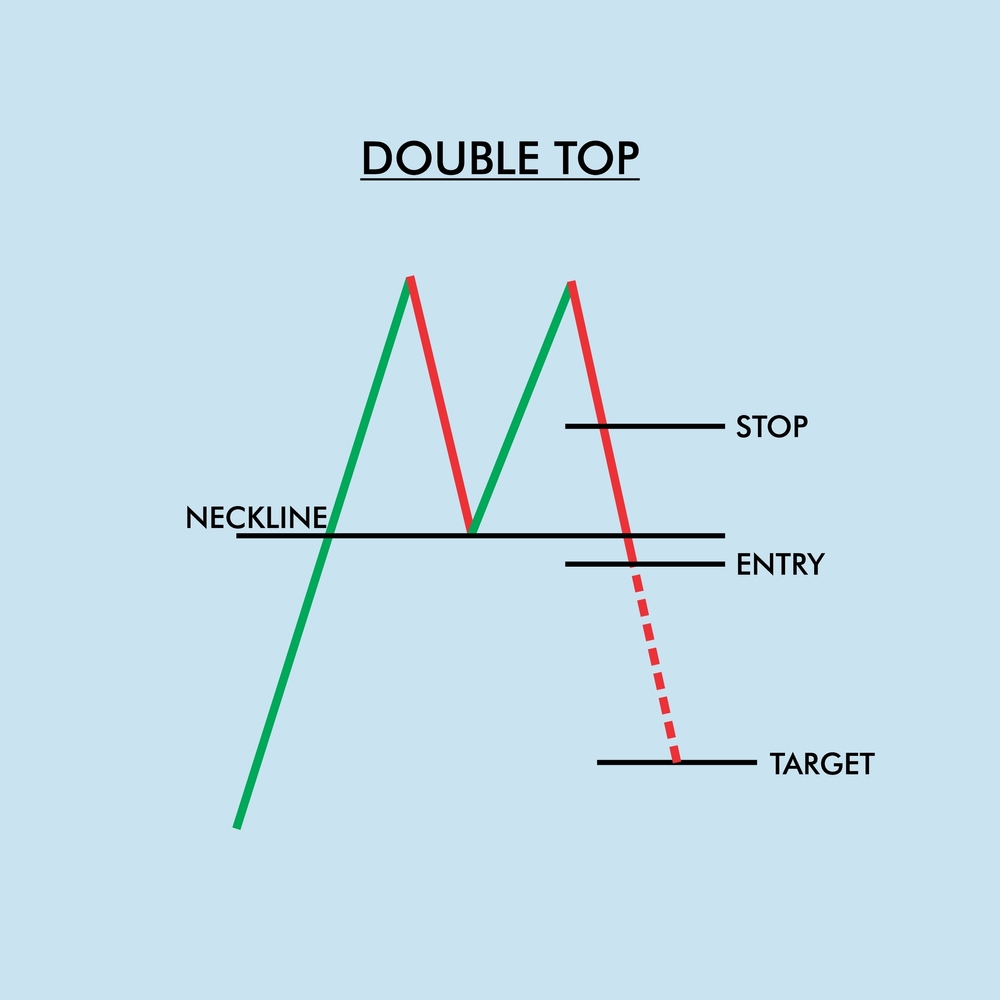
A double top is a classic bearish reversal pattern. It forms when price tests a resistance level twice, fails to break higher both times, and then drops below support (the neckline). On the chart, it creates a clear M-shaped structure.
This pattern signals that an uptrend is running out of steam. Buyers attempt to push prices to new highs, but are met with strong selling pressure. By the second top, bullish momentum is weaker, and sellers begin to take control. Often, the second peak is slightly lower than the first, an early warning that buying strength is fading. The pattern is only confirmed once the price breaks below the neckline. Entering too early, based only on the two peaks, can lead to false signals.
To trade the double top effectively, wait for a clean break below the neckline before entering a short position. You can enter on the initial breakdown or wait for a retest of the neckline as new resistance. Place your stop-loss just above the second top to protect against failed breakdowns. A common profit target is the height of the pattern projected downward from the neckline.
When combined with volume confirmation and broader market context, the double top becomes a reliable tool for spotting high-probability bearish reversals.
Rounding Top Chart Pattern
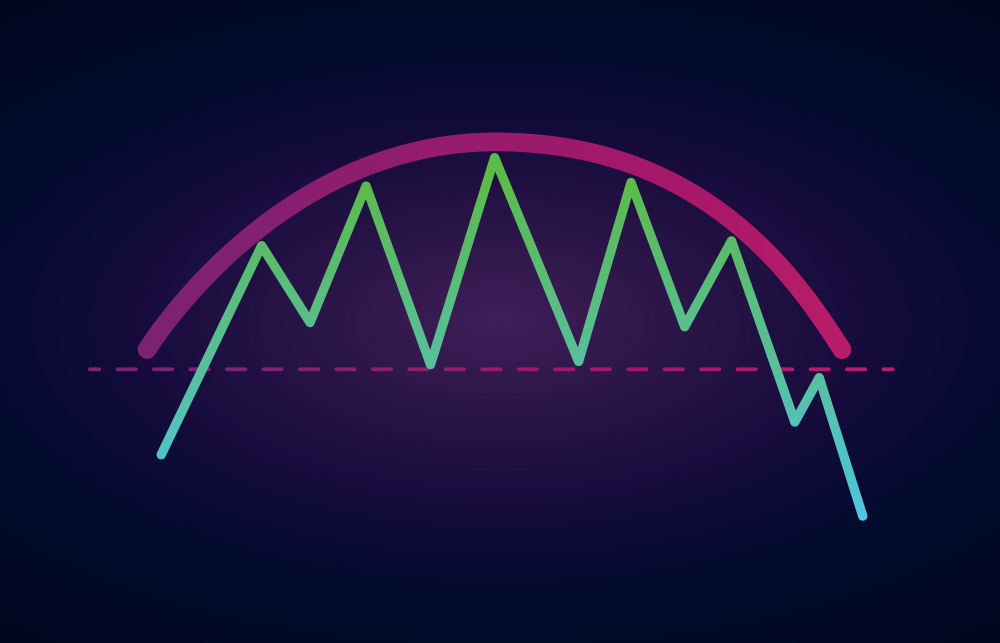
A rounding top is a bearish reversal pattern that signals a gradual loss of buying momentum before a breakdown. On the chart, it appears as an inverted U-shaped curve, showing a slow transition from buyer control to seller dominance.
In the rounding top chart pattern, the price continues making higher highs at first, but each upward push becomes weaker. Eventually, the highs begin to fall, revealing that buying pressure is fading and sellers are quietly taking control.
As the pattern matures, the price starts moving sideways with a slight downward bias, forming a smooth, rounded structure. A support level (the neckline) develops at the base of the pattern. The rounding top is only confirmed once the price breaks below this support; before that, it remains a potential setup. Once the neckline breaks, it signals the start of a new downtrend.
Early in the pattern, buyers are still active. But the sequence of lower highs is the market's way of signaling that sentiment is shifting. When sellers finally take over, the breakdown tends to accelerate.
This slow, visible transfer of control from buyers to sellers is what makes the rounding top such a powerful reversal pattern when confirmed.
Head and Shoulders Chart Pattern
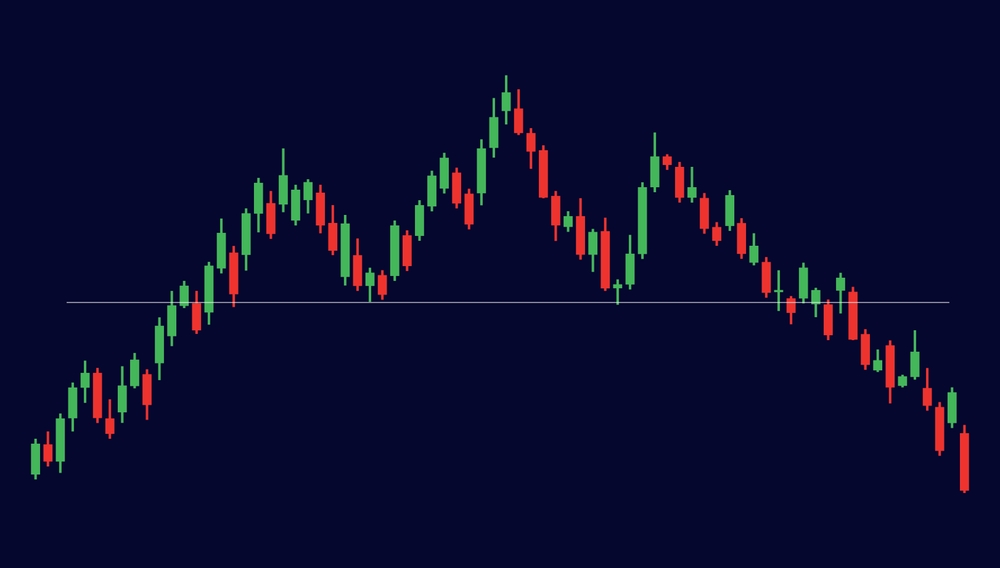
A head and shoulders is a powerful bearish reversal pattern that signals a shift from bullish to bearish market control. It forms when price makes three consecutive highs, with the middle peak (the head) higher than the two outer peaks (the shoulders).
The pattern develops in stages. First, price pushes to a new high and pulls back to a support level, which forms the left shoulder. Buyers then make one stronger push to a higher high, the head, before the price again falls back to the same support area, known as the neckline. Finally, price pushes again, but this time forms a lower high, the right shoulder, showing that buying momentum is fading.
The pattern is confirmed when the price breaks below the neckline. This breakdown signals that sellers have taken control, and a downtrend is likely to follow.
To trade the head and shoulders effectively, wait for a clean break below the neckline before entering a short position. A conservative entry is to wait for a retest of the neckline as resistance. Stop-losses are typically placed above the right shoulder, while profit targets are projected by measuring the height from the head to the neckline and extending it downward.
Descending Triangle

A descending triangle is a bearish continuation pattern that signals building selling pressure. It forms when price creates a series of lower highs while repeatedly testing a flat support level. This structure shows that sellers are becoming more aggressive, pushing prices down earlier on each rally, while buyers are only able to defend the same support zone.
Over time, the range tightens as price compresses between descending resistance and horizontal support. This period is known as consolidation. If the price eventually breaks below the support level, the pattern is confirmed, and a further downward move is likely.
Although descending triangles typically appear after a downtrend and favor bearish continuation, traders should always wait for confirmation. In some cases, price may break above the descending resistance instead, signaling a potential trend reversal.
To trade this pattern effectively, wait for a clear breakout before entering. A short position is usually taken on the support break or on a retest of the broken level as resistance. Stop-losses are commonly placed above the most recent lower high, while profit targets can be projected by measuring the height of the triangle and extending it in the breakout direction.
Volume also plays an important role. Ideally, volume declines during the formation of the triangle and expands sharply on the breakout, adding confidence to the move.
Read More: Average True Range (ATR): How to Measure Volatility and Set Better Stop Losses
Best Continuation Chart Patterns
Not every chart pattern signals a reversal. Some patterns are designed to help traders stay in a trend rather than exit it. These are called continuation patterns; they appear when the market takes a brief pause before continuing in the same direction.
Flag Pattern

A flag pattern is a short-term consolidation that occurs after a strong directional price move. The price drifts within parallel trendlines, forming a rectangular "flag" shape, while the preceding move acts as the "flagpole."
Flag patterns usually signal a continuation of the prevailing trend. A bullish flag suggests the uptrend will resume, while a bearish flag indicates the downtrend is likely to continue.
The pattern forms in three stages: a strong directional move (the flagpole), a pause or countertrend within parallel lines (the flag), and finally a breakout in the direction of the original trend.
To trade the flag pattern, enter the trade once the price breaks out of the flag pattern in the direction of the trend. Place your stop-loss within the flag structure to protect against reversals. Confirm this trend by looking out for a surge in volume during the breakout, which validates that momentum is continuing in the trend's direction.
Symmetrical Triangle

A symmetrical triangle occurs when price consolidates with higher lows and lower highs, creating converging trendlines. It generally signals trend continuation, as the market pauses before resuming its prior direction. However, if no trend exists beforehand, the breakout could go either way, making it a neutral pattern.
This occurs when buyers and sellers gradually push prices into a narrowing range, reflecting equilibrium in market forces. This compression continues until a breakout occurs.
Trade the breakout once the price moves above or below the converging trendlines. Place your stop-loss within the triangle to manage risk. Watch for decreasing volume during the formation of the triangle and a significant increase at the breakout, which confirms the move.
Rectangle Consolidation
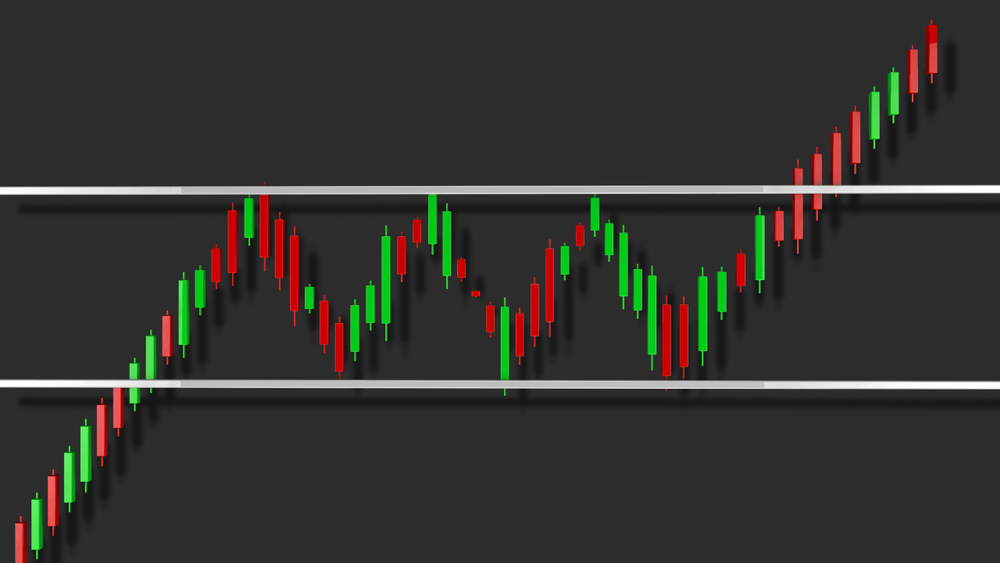
A rectangle consolidation forms when price moves sideways between clearly defined horizontal support and resistance levels, reflecting a temporary pause in the trend.
Rectangles indicate that the trend is likely to continue once the price breaks out of the consolidation range, either upward or downward. It forms when the price repeatedly bounces between the horizontal support and resistance lines, showing indecision among buyers and sellers.
Enter a trade in this chart pattern when the price breaks above resistance for bullish continuation or below support for bearish continuation. Place your stop-loss just inside the rectangle to protect your position.
Remember, a strong volume spike at the breakout confirms that the trend continuation is likely genuine.
Understanding continuation patterns allows traders to enter strong trends at better prices instead of chasing breakouts late.
Tools to Help You Read Chart Patterns
While chart patterns are visual by nature, using the right tools can make spotting setups faster and more accurate. For day traders in 2026, these tools are essential:
Technical Indicators
Indicators confirm patterns and provide additional context:
Volume: Confirms the strength of a breakout or reversal. Rising volume during a breakout signals genuine participation.
Moving Averages (MA/EMA): Help identify trend direction and support/resistance levels. Patterns aligning with the MA direction have higher reliability.
Relative Strength Index (RSI): Detects overbought or oversold conditions, helping avoid false breakouts.
Average True Range (ATR): Measures volatility and helps set smarter stop-loss levels.
Charting Platforms
Modern platforms offer advanced tools to identify and monitor patterns:
- TradingView: Supports pattern recognition, alerts, and custom indicators.
- MetaTrader 4/5: Offers built-in technical tools and strategy testing.
- Thinkorswim: Excellent for volume analysis and multi-timeframe pattern tracking.
Calculators
Our trading calculators help you make smarter, more disciplined decisions:
- Risk-Reward Calculator: Instantly evaluate whether a trade aligns with your strategy.
- Position Size Calculator: Calculate the optimal trade size to manage exposure and protect your capital.
- Profit Target Tool: Automatically project realistic targets based on pattern height or breakout levels.
- Risk Management Calculator: Helps you calculate and manage risks before placing a trade.
Access all of our calculators here.
Using these tools alongside your eyes and judgment helps reduce mistakes, confirm trades, and increase confidence in your trade setups.
Related Read: Candlestick Day Trading Patterns: How to Read and Trade Like a Pro
Conclusion
Chart patterns are not just pretty shapes on a chart; they are a map of market psychology. For day traders, mastering them means seeing opportunities before most traders do, defining risk clearly, and executing with confidence.
But the real edge comes from combining patterns with tools, volume, confirmation, and disciplined risk management. Practice consistently, backtest strategies, and focus on a few high-probability patterns rather than chasing every setup.
In 2026, with the right patterns, tools, and mindset, day traders can navigate volatile markets with clarity and precision.
Frequently Asked Questions
Which chart pattern is best for beginners?
Double bottoms, bull flags, and head & shoulders are beginner-friendly because they offer clear entry points and defined risk levels.
How do I confirm a chart pattern before trading?
Use volume, moving averages, and RSI to confirm breakouts or reversals. Wait for price action to validate the pattern, rather than trading prematurely.
Can chart patterns be used in crypto and forex?
Yes. Patterns work in any liquid market, including stocks, crypto, forex, and indices.
How many patterns should I focus on as a day trader?
Focus on 3–5 patterns and master them. Depth of knowledge beats quantity for consistent results.
Are chart patterns more reliable on certain timeframes?
Day traders often use 1-minute to 15-minute charts, with confirmation from 1-hour or daily charts for trend context.
What mistakes should I avoid when trading patterns?
Common mistakes include entering too early, ignoring volume, trading against higher-timeframe trends, overtrading, and setting stop-loss too tight.
Which tools improve pattern recognition?
Volume, RSI, ATR, moving averages, and charting platforms like TradingView, MetaTrader, and Thinkorswim significantly improve accuracy and confidence.
Follow Us On Social Media