


Among all the continuation patterns, the descending triangle stands out as one of the clearest bearish chart patterns. It visually shows sellers gaining strength while buyers gradually lose control of support.
For day traders and swing traders, the descending triangle provides a structured way to participate in downtrending markets without guessing. In this guide, I'll break down exactly what the descending triangle pattern is, how to identify it correctly, the psychology behind its formation, and proven strategies to trade its breakout with confidence.
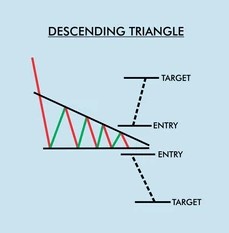
What Is the Descending Triangle Chart Pattern?

The descending triangle pattern is a bearish chart formation defined by first, a horizontal support line at the bottom, followed by a downward-sloping resistance line at the top. This structure shows price repeatedly testing a support level while forming lower highs. As the range tightens, pressure builds until the support level eventually breaks, often leading to a sharp downward move. Visually, the pattern forms a triangle that slopes downward toward a flat base.
Most commonly, the descending triangle acts as a bearish continuation pattern, meaning it usually forms during an existing downtrend before the price continues lower. However, in some cases, it can appear at the end of an uptrend and signal a bearish reversal. Context always matters. The descending triangle pattern is primarily bearish because sellers are becoming more aggressive while buyers fail to lift prices higher.
One thing you have to know about the descending triangle pattern is that at first, buyers successfully defend a support level, stepping in each time the price drops. However, sellers begin entering earlier on every bounce, creating a series of lower highs. This tells us that selling pressure is increasing, while buyer conviction is weakening. As this continues, the support line becomes a critical level. Once buyers finally run out of strength, the support breaks, often triggering stop-loss orders and fresh short positions. This chain reaction is what fuels the sharp breakdown that typically follows.
How the Descending Triangle Pattern Forms
A descending triangle usually appears after an existing downtrend. It forms as the price begins to compress between a flat support level and a downward-sloping resistance line. Buyers continue to defend the same support zone, but sellers step in earlier each time, creating a series of lower highs. This gradual tightening of price action signals growing selling pressure in the market.
Take, for example, a forex pair like EUR/USD that has already been in a steady downtrend, falling from 1.1200 to 1.0800. After this decline, the price starts to stall around 1.0750, where buyers consistently step in to defend the level. Each time price bounces, however, sellers re-enter earlier, first pushing price down from 1.0900, then 1.0850, then 1.0820. These lower highs form a downward-sloping resistance line, while 1.0750 remains flat support.
As the pattern develops, over several trading sessions, the price moves in a tightening range between these two levels, showing increasing selling pressure. Eventually, buyers fail to hold 1.0750. The pair closes decisively below support at 1.0720 with increased volume. This confirms the descending triangle breakdown, and the prior downtrend resumes as the price continues falling toward 1.0600.
The pattern is only confirmed when the price clearly closes below the support line, not just briefly dips under it. Once confirmed, the prior downtrend typically resumes.
Key Components to Identify a Descending Triangle
Here are the key components to identify a descending triangle:
- Support line: Draw a horizontal line connecting at least two similar swing lows. This marks the level buyers are trying to defend.
- Resistance line: Draw a downward-sloping trendline connecting at least two lower highs. This descending resistance is the defining feature of the pattern; without lower highs, it is not a true descending triangle.
- Tightening range: Price should move within a narrowing space between support and resistance, forming a triangular structure.
- Volume Behavior: Volume usually decreases as the triangle forms, reflecting market indecision. A valid breakdown is often accompanied by a noticeable spike in volume. If price breaks support on weak volume, it may signal a false move rather than a true continuation.
- Timeframe Reliability: Descending triangles can appear on any timeframe. Daily and weekly patterns tend to produce more reliable signals for swing traders. Intraday patterns can work for day traders but require tighter risk management due to higher noise.
In simple terms, a descending triangle shows sellers gaining control step-by-step. Once support finally breaks, it often leads to a strong continuation of the existing downtrend.
Related Read: How to Calculate Position Size & Manage Risk Like a Pro Trader
How to Trade the Descending Triangle
Once a descending triangle is properly identified, trading it becomes a structured and repeatable process. Here are some strategies to trade the descending triangle chart pattern:
Entry Strategy
The most common entry method is the breakdown entry, where traders wait for the price to close clearly below the horizontal support line. Ideally, this breakdown should be accompanied by rising volume, as increasing volume confirms that sellers are in control and the breakout is more likely to hold.
Some traders prefer a more patient approach called the retest entry. In this case, after price breaks below support, they wait for a pullback to the old support level, which now acts as resistance. When the price rejects this level and starts moving lower again, they enter the trade. This method often provides a better risk-to-reward ratio because entries are closer to resistance, allowing for tighter stop-loss placement.
Stop-Loss
Stop-loss positioning is crucial for managing risk. A conservative stop-loss is placed above the most recent lower high inside the triangle, giving the trade more breathing room. A more aggressive stop-loss can be set just above the broken support line to minimize risk. The choice depends on your trading timeframe and risk tolerance.
Profit Target
To calculate a profit target, traders measure the height of the triangle, from the highest resistance point to the support line, and project that distance downward from the breakdown point. This gives a realistic minimum target based on how far the price is likely to move after the breakout.
Finally, remember that volume plays an important confirmation role throughout the pattern. Volume typically declines as the triangle forms and should expand sharply during the breakdown. A breakout on weak volume is often a warning sign of a false move. When traded with proper confirmation and risk management, the descending triangle becomes a reliable continuation pattern for capturing bearish momentum.
Confirmation tools that help improve the accuracy of reading this chart pattern include:
- Volume: A true breakdown almost always comes with strong volume participation.
- RSI: Look out for bearish divergence near the final lower high adds conviction. RSI breaking below 50 after the breakdown confirms a momentum shift
- Moving Averages: Price trading below key moving averages (50 or 200 MA) supports a bearish bias. A breakdown that also loses MA support carries a stronger probability
Used together, these tools filter false breakouts and strengthen trade confidence.
Related Read: How to Master and Trade the Ascending Triangle Chart Pattern
Descending Triangle vs Ascending Triangle
Both ascending and descending triangles are popular continuation patterns, meaning they usually appear in the middle of an existing trend and signal that the trend is likely to continue after consolidation.
A descending triangle forms when the price creates a flat support line while the highs keep getting lower. This produces a horizontal lower trendline and a downward-sloping upper trendline. It shows that sellers are becoming more aggressive, pressing prices down toward support. When that support finally breaks, it often leads to a bearish continuation and presents an opportunity to enter short positions with a clear profit target.
An ascending triangle, on the other hand, forms when price meets a flat resistance level while the lows keep rising. This creates a horizontal upper trendline and an upward-sloping lower trendline. It reflects growing buying pressure as buyers step in earlier each time. A breakout above resistance usually signals a bullish continuation and offers a structured entry for long trades.
While both patterns are most commonly continuation setups, ascending triangles can occasionally appear at the end of a downtrend and act as reversal patterns. However, in most cases, they are viewed as bullish continuation structures, whereas descending triangles are seen as bearish continuation structures.
Conclusion
The descending triangle remains a powerful pattern because it visually captures the shift from buyer defense to seller dominance. When identified correctly and confirmed with volume and indicator alignment, it offers traders a structured way to enter downtrending moves without emotional guessing.
Like every trading tool, its power comes from confirmation, risk management, and consistency, not from the pattern alone. Combine it with RSI, moving averages, and other relevant tools to plan entries, stops, and targets objectively. Used this way, the descending triangle becomes a reliable part of a disciplined trading strategy rather than just another chart shape.
Read More: Best Chart Patterns for Day Trading in 2026 (With Examples & Trading Tips)
Frequently Asked Questions
Is the descending triangle pattern bearish or bullish?
The descending triangle is primarily bearish. It shows sellers becoming more aggressive while buyers fail to push the price higher.
How reliable is the descending triangle pattern?
It is considered a reliable continuation pattern when confirmed by strong volume and broader trend alignment. Like all patterns, it can fail without confirmation.
What timeframe is best for trading descending triangles?
Daily and weekly charts offer the most reliable setups. Intraday traders can use lower timeframes with tighter risk management.
Can a descending triangle fail?
Yes. False breakdowns occur when the price briefly breaks support but quickly reclaims it. Volume confirmation helps filter these traps.
Follow Us On Social Media