


The Head and Shoulders chart pattern is one of the most reliable trend reversal patterns in technical analysis. Traders use it to catch market reversals early, before the big move happens. In 2026, with the rise of AI-powered chart scanners, pattern recognition has become even easier, making the head and shoulders pattern a must-know strategy for anyone trading stocks, forex, crypto, or indices.
This guide breaks this chart pattern clearly, what it is, how to identify it, how to trade it, provides real chart examples, and explains the most common mistakes to avoid when trading the head and shoulders pattern.
What Is a Head and Shoulders Chart Pattern?
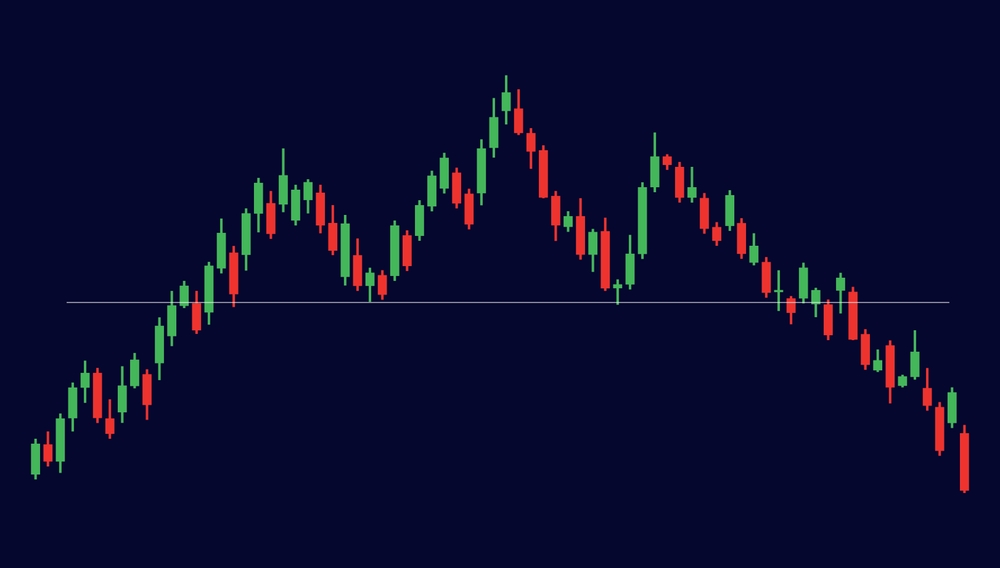
The Head and Shoulders chart pattern is a bearish reversal pattern that forms after an uptrend. It signals that the upward momentum is weakening and the price may soon reverse downward.
The structure looks like this:
Left Shoulder: The left shoulder pattern forms when the price rises, causing an upward move, representing a temporary high which eventually falls. This typically occurs when there is a brief pullback against the uptrend, triggered by profit-taking or exits by traders.
Head: Here, the price rises higher than before, a higher peak than the left shoulder, then falls again. The head is the highest point of the pattern, showing that buyers are still in control and pushing the price higher, but again, sellers begin to enter strongly, causing a sharp decline. This pullback is more pronounced than the one after the left shoulder, showing weakening bullish momentum.
Right Shoulder: The right shoulder forms when the price rises once more, but this time lower than the head, indicating a weakening momentum. This means that buyers are getting weak as they couldn't push the price higher, but sellers are strong as they continue to lower the price.
Neckline: The neckline is a crucial support level in the Head and Shoulders pattern, drawn by connecting the two low points (dips) that occur between the left shoulder and the head, and the head and the right shoulder. This support line can be either horizontal or sloping, signalling the confirmation of the pattern and the beginning of a downward trend.
Volume Behavior: The volume behavior within the Head and Shoulders chart pattern is a key indicator: volume is typically strongest during the formation of the left shoulder and the head, but it weakens as the right shoulder is formed. Crucially, the final breakout of the pattern should be accompanied by strong selling volume.
This pattern helps traders anticipate a trend reversal before the downtrend officially begins. Traders find it a reliable trend reversal pattern to determine a bullish-to-bearish trend reversal and signal that an upward trend is ending.
Related Read: Candlestick Day Trading Patterns: How to Read and Trade Like a Pro
How to Identify a Valid Head and Shoulders Pattern
You have to avoid fake patterns. To determine if a head and shoulders pattern is real, here is what to look for:
- Must occur after a clear uptrend
- The head is the highest peak
- The right shoulder is lower than the head
- Neckline is clean (flat or downward sloping)
- Volume weakens during the right shoulder
- Breakout occurs with strong bearish volume
Avoid patterns forming in choppy or sideways markets.
How to Trade the Head and Shoulders Pattern

Here is how to trade the Head and Shoulders pattern successfully:
Find the Uptrend: Make sure the market has been moving up before the pattern starts.
Identify the Key Parts: Identify the left Shoulder, head, and the right shoulder. The head is the highest point, and the shoulders must be lower than the head. Draw the neckline by connecting the two low points that form between the shoulders and the head.
Choose Your Entry: There are two main strategies for entering a short position based on the Head and Shoulders chart pattern once the neckline has been broken. The aggressive approach involves entering the trade as soon as the price closes below the neckline. The conservative method, however, is more cautious; traders wait for the price to drop below the neckline, then move back up to touch the neckline (which now acts as resistance) before entering the short position, a strategy that helps to reduce false signals.
Place Your Stop-Loss (SL): When setting a Stop Loss (SL) for a Head and Shoulders pattern trade, a common approach is to place it just above the Right Shoulder. For a very conservative and safer position, the SL should be placed above the Head.
Set Your Profit Target: To set a price target, first measure the vertical distance between the Head and the Neckline. Then, subtract that distance from the Neckline Breakout Price. For instance, if the Head is at $120 and the Neckline is at $110 (a $10 difference), the target price would be $110 minus $10, resulting in a target of $100.
The Head and Shoulders pattern is a powerful reversal signal that appears across different markets. For instance, in 2024, AAPL's daily chart showed a clear pattern, and the price predictably dropped 8% after the $180 neckline broke. Bitcoin also exhibited this classic behavior at the $72,000 level, plunging nearly $3,000 in just hours once the neckline failed.
Furthermore, in the Forex market, the EUR/USD pair confirmed the pattern with lower volume and MACD divergence on the right shoulder, leading to a significant 120-pip drop after the 1.0850 neckline was breached. These examples demonstrate the reliability of the Head and Shoulders pattern as a warning sign for an impending trend reversal.
Related Read: Best Indicators for Cryptocurrency Trading: What Works and How to Use Them
Risk Management Tips
To manage risks when trading the head and shoulders pattern, here are key trading rules to follow:
Don't Chase: If you miss the initial drop (breakout), do not rush to enter. Wait for a pullback (re-test of the neckline).
Trail Your Stop-Loss: Once the trade is moving in your favor, use an indicator (like a 20-day Moving Average) to move your stop-loss and protect your profit.
Risk/Reward: By placing your stop-loss above the right shoulder, you can often aim for a good risk-reward ratio; a safe reward-to-risk ratio is 2:1 or better. Never risk more than 1–2% of your capital on one trade.
Increase your confidence by confirming the pattern with these technical indicators: RSI bearish divergence, MACD crossover, and Volume breakout.
Pros & Cons of Head and Shoulders Pattern
Pros
- Indicates a strong Bearish trend.
- Offers a favorable risk-to-reward ratio with clear entry and exit points.
- Effective when using multiple timeframes (using a bigger timeframe increases accuracy).
- Experienced traders can identify it easily.
- Provides defined profit and risk targets.
- Allows profiting from significant market movements.
- Applicable across all markets.
Cons
- Requires a high degree of patience.
- Needs further confirmation for accuracy (e.g., studying Price Action).
- Beginner traders might not know how to identify this pattern.
- It can sometimes require large stop-loss distances.
- The neckline's position may appear to shift.
Mistakes to Avoid when Trading the Head and Shoulders Pattern
To trade the Head and Shoulders pattern successfully, avoid these common mistakes:
- Entering a trade before the neckline has definitively broken.
- Placing a stop-loss order too close to the entry point (too tight).
- Misidentifying a genuine "shoulder" in a chart that is overly erratic or noisy.
- Assuming any formation with three peaks is a valid Head and Shoulders pattern.
- Trading this pattern when the market is choppy or moving sideways.
- Ignoring the necessary confirmation provided by trading volume.
Remember that patience is key to successful trading.
Final Thoughts
The Head and Shoulders chart pattern remains a cornerstone of trading strategies in 2026. Whether you're trading stocks, crypto, or forex, the pattern provides reliable high-probability signals when used with volume confirmation, smart entries, and proper risk management.
It works best when traders are patient, wait for the breakout or retest, and combine it with momentum or volume indicators.
Read More: How to Trade Momentum Stocks: Strategies, Indicators & Risk Management
Sources
- Investopedia: Understanding the Head and Shoulders Pattern in Technical Analysis
- Traders: Head and Shoulders Pattern Explained
- TradingView: Secrets of the Head & Shoulders Pattern for Profitable trade
Frequently Asked Questions
Is the head and shoulders pattern bullish or bearish?
The head and shoulder pattern is a bearish reversal pattern. The inverse version is bullish.
How reliable is the pattern?
Very reliable, one of the highest success rates among chart patterns, especially with volume confirmation.
What timeframes work best?
For the strongest, cleanest Head and Shoulders signals, focus on Daily and 4-Hour (4H) charts. These longer timeframes reduce market "noise" from random, intraday fluctuations and represent more significant shifts in market sentiment. A pattern forming over days or weeks offers a more reliable and powerful breakout than one on a shorter timeframe. Higher timeframes also provide a clearer, less ambiguous neckline, defining better entry and exit points. While the pattern appears on shorter charts, the risk of failure is much higher.
Does the head and shoulders pattern work in crypto?
Yes, but crypto is volatile, so fake breakouts are more common. Always wait for a confirmed close below the neckline.
How do I confirm the breakout?
To help eliminate fakeouts when trading the Head and Shoulders pattern, look for strong bearish volume, the Relative Strength Index (RSI) to be below 50, and the closing price to be clearly outside the neckline.
What is the difference between head & shoulders and an inverse version?
The inverse head and shoulders pattern signals a bullish reversal and typically appears following a downtrend.
Does the head and shoulders pattern still work in 2026?
This pattern is still dependable today because many different market players act in similar ways. AI pattern recognition tools like TradingView, TrendSpider, and FinViz detect it quickly, while High-Frequency Trading (HFT) algorithms follow similar reversal signals. Big financial firms watch closely when the 'neckline' breaks, and individual traders heavily use these visual chart patterns. Because so many different groups pay attention to it, the pattern remains a reliable sign of a market change.
Follow Us On Social Media