


In technical analysis, traders use the rounding top pattern to identify bearish reversals in the market. The rounding top pattern unfolds slowly, almost quietly, as momentum fades and control shifts from buyers to sellers, unlike other sharp reversal patterns that form quickly.
The rounding top reflects a gradual loss of buying pressure and a slow buildup of selling interest. Traders who understand this pattern aren't trying to predict the top; they're waiting for confirmation that the trend has already started to change.
Let's break down how the rounding top pattern works, what it signals, and how to trade it properly without rushing into low-probability setups.
What Is the Rounding Top Pattern?
The rounding top is a bearish reversal chart pattern that develops after a sustained uptrend, signaling a gradual shift from rising prices to declining ones. Instead of forming a sharp peak, the market creates a smooth, dome-shaped curve, showing that buying pressure is slowly fading rather than collapsing abruptly. Buyers remain active but lack the strength to push prices higher, and once the price breaks below a key support level at the base of the curve, the pattern is confirmed, often marking the start of a downtrend.
This formation is the opposite of the rounding bottom: while the bottom reflects slow accumulation, the top reflects slow distribution. Typically, prices rise to new highs before steadily declining from resistance, with trading volume peaking during the initial rise and again during the selloff phase. Recognizing this change allows traders to lock in profits, avoid unfavorable entries, or capitalize on falling prices through short-selling.
The rounding top's distinctive inverted U-shape can appear across different time frames, from intraday charts to weekly or monthly charts, though signals tend to be more reliable on longer horizons. Just like the head and shoulders pattern, it often features a neckline, and traders watch for shorting opportunities when the price breaks that level below.
In essence, the rounding top highlights weakening demand and growing selling pressure, offering a clear warning of a potential bearish outlook.
Read More: How to Identify and Trade the Double Bottom Pattern
How the Rounding Top Pattern Forms
The rounding top typically develops in distinct stages, each marked by changes in price behavior, volume, and trader psychology.
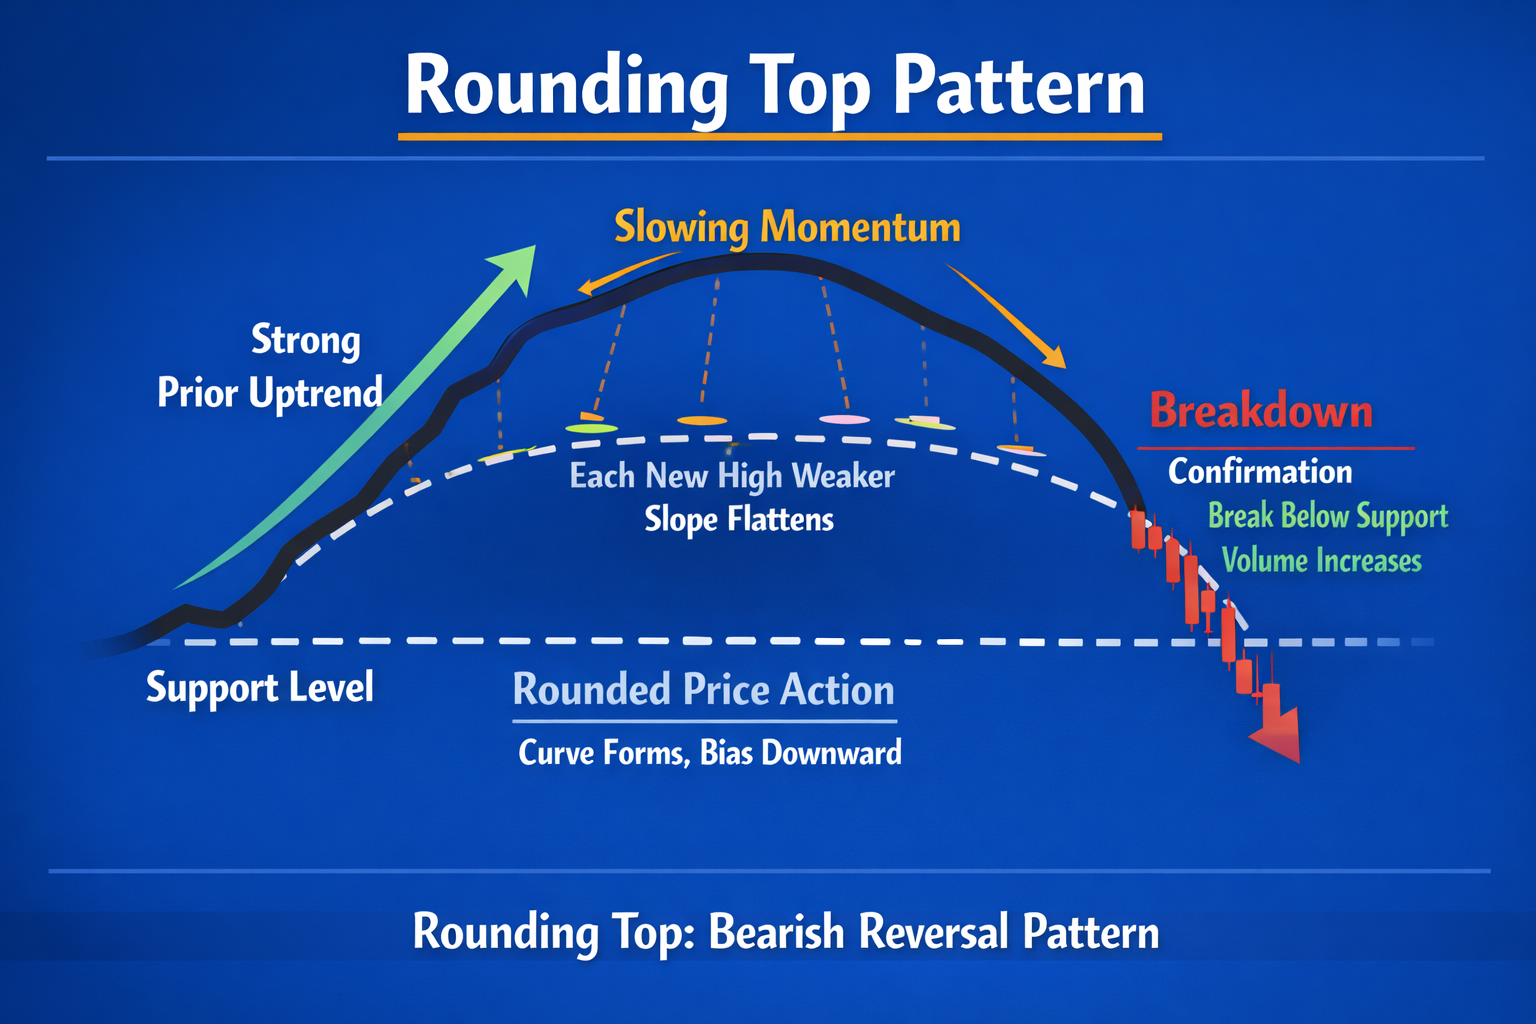
- Strong Prior Uptrend: The pattern begins after a well-established uptrend. Price consistently makes higher highs and higher lows, signaling strong buyer control. Trading volume is usually elevated during this phase, confirming high demand and bullish sentiment.
- Slowing Momentum: As the trend matures, upward price moves continue but become increasingly weaker. Each new high advances less than the previous one, and the slope of the uptrend starts to flatten. This phase reflects early signs of buyer exhaustion.
- Rounded Consolidation Phase: Price action becomes sideways with a slight downward bias, forming the characteristic smooth, curved top rather than sharp peaks. Volatility decreases, volume declines, and buying pressure fades. During this phase, price may form incomplete double or triple tops, reinforcing the loss of bullish momentum.
- Support Level Formation: A clear horizontal support level (often referred to as the neckline) develops at the base of the rounding structure. This level represents the final area where buyers attempt to defend price.
- Breakdown and Confirmation: The rounding top is only confirmed when the price decisively breaks below the support level, ideally accompanied by expanding volume. This breakdown signals the start of a new bearish trend as sellers gain full control.
Important: A rounding top is not valid until support breaks. Everything before that is potential, not confirmation.
Volume plays a critical role in confirming the rounding top pattern. Typically, trading activity is high during the early uptrend as buyers drive prices higher, but volume gradually declines throughout the rounding phase as momentum slows and buying pressure weakens. When the breakdown occurs, volume increases again as sellers take control and push prices lower. This progression creates an inverted volume structure, with elevated activity at both ends of the pattern and reduced volume in the middle, reinforcing the reliability of the signal.
Duration and Timeframe Considerations
Rounding top patterns take time to develop. They typically form over several weeks to several months, and in some cases, years, depending on market conditions and timeframe.
According to Thomas Bulkowski in the Encyclopedia of Chart Patterns, successful rounding tops often take 182 to 371 days (roughly 6 months to 1 year) to fully form.
Patterns that develop on higher timeframes, such as daily, weekly, or monthly charts, tend to be more reliable. For this reason, rounding tops are especially well-suited for swing traders and position traders rather than short-term scalpers.
Read more: Cup and Handle Pattern: How It Works and How to Trade It (2026 Guide)
How to Trade the Rounding Top Pattern

Trading the rounding top is less about speed and more about discipline. The goal is not to catch the exact top but to trade the confirmed shift in trend.
Entry Strategy: Wait for Confirmation
The safest entry is after price breaks and closes below the support level at the base of the rounding structure.
More aggressive traders may enter on a retest of broken support, but this approach requires experience and strict risk management.
Entering before the breakdown increases the risk of getting trapped if the uptrend resumes.
Stop-Loss Placement
Risk control is essential because rounding tops form slowly. Common stop-loss placements include:
- Above the most recent swing high
- Above the rounding structure itself
- Above the retest high if entering on a pullback
Avoid placing stops too tightly. These patterns often experience small whipsaws before continuation.
Profit Targets
A simple projection method can be used to estimate price targets in a rounding top pattern. Traders measure the height from the top of the structure down to the support level, then project that same distance downward from the breakdown point to identify a potential target. It is important to adjust these targets based on nearby support zones and overall market conditions, while also considering partial profit-taking to effectively manage risk.
Best Indicators to Confirm a Rounding Top Pattern
When trading this chart pattern, use indicators to strengthen your confirmation. However note that this does not replace price action.
Helpful tools include:
- Volume: Breakdown should occur with rising volume
- RSI: Bearish divergence during the rounding phase
- Moving averages: Price breaking below key averages adds confirmation
- Trendlines: A break of an ascending trendline supports the reversal
When multiple signals align, the setup becomes more reliable.
Related Read: How to Trade Momentum Stocks: Strategies, Indicators & Risk Management
Mistakes to Avoid When Trading The Rounding Top Pattern
Many traders struggle with rounding tops because they rush the setup and do not wait for confirmation before entry. Here are some common errors to avoid when trading this chart pattern.
- Shorting before the support break: One of the biggest errors traders make is trying to short too early, before the price has actually broken below the support level at the base of the rounding structure. Until that breakdown occurs, the pattern is only potential, not confirmed. Entering prematurely exposes traders to the risk of the uptrend resuming, which can quickly trap them in losing positions.
- Ignoring volume confirmation: Volume plays a critical role in validating the rounding top. A proper breakdown should be accompanied by expanding volume, showing that sellers are firmly in control. Ignoring this confirmation can lead to false signals, where price dips below support briefly but rebounds due to weak selling pressure.
- Confusing consolidation with a rounding top: Not every sideways or flattening price action is a rounding top. Consolidation phases can look similar but may simply be pauses in an ongoing uptrend. Mistaking ordinary consolidation for a rounding top can cause traders to misinterpret market sentiment and enter trades against the prevailing trend.
- Trading the pattern against a strong higher-timeframe uptrend: Even if a rounding top appears on a shorter time frame, it may fail if the broader market trend is still strongly bullish. Higher-timeframe analysis is essential to avoid trading against dominant momentum. Ignoring this context can result in false breakdowns and failed trades.
- Overleveraging slow-developing setups: Rounding tops take time to form, often spanning weeks or months. Traders who overleverage while waiting for the breakdown risk tying up capital in a slow-developing setup and suffering losses if the pattern fails. Patience and proper position sizing are crucial when trading these gradual reversals.
The rounding top rewards patience, not anticipation.
Pros and Cons of the Rounding Top Pattern
The rounding top is a well-known bearish reversal pattern, but like any technical setup, it has strengths and limitations. Understanding both helps traders use it effectively and avoid common mistakes.
Pros of the Rounding Top Pattern
- Clear bearish reversal structure: The rounding top provides a well-defined framework for identifying a potential shift from an uptrend to a downtrend. When confirmed, it offers a high-probability bearish reversal signal.
- Strong psychological foundation: This pattern reflects a gradual loss of buying pressure rather than a sudden collapse. Buyers slowly lose control, sellers gain confidence, and sentiment shifts naturally, making the reversal more sustainable.
- Defined entry and exit points: Once price breaks below the neckline (support), traders have a clear entry trigger. Profit targets can be projected using the height of the pattern, while stop-loss levels are typically placed above recent swing highs.
- Volume-based confirmation: The rounding top pairs well with volume analysis. Declining volume during consolidation and expanding volume on the breakdown help validate the pattern and strengthen bearish conviction.
- Versatile across markets: This pattern works across stocks, crypto, forex, indices, and commodities, and can be applied on daily, weekly, and monthly timeframes.
- Early warning of bear trends: Because the pattern forms gradually, it often provides advance notice of a potential trend reversal, allowing traders time to plan rather than react emotionally.
- Ideal for swing and position traders: Due to its longer formation period, the rounding top is best suited for swing and position trading strategies rather than short-term scalping.
Cons of the Rounding Top Pattern
- Slow to develop: Rounding tops can take weeks or months to fully form, which makes them unsuitable for traders who prefer fast-moving setups.
- Requires patience and discipline: Premature entries before confirmation often lead to losses. Traders must wait for a clear breakdown and volume confirmation.
- Prone to false breakouts: Price may briefly break below support and then reclaim it, especially in volatile markets. Without volume confirmation, breakdowns can be misleading.
- Less effective in strong bullish markets: In powerful uptrends, rounding tops may fail as buyers regain control and push prices higher.
- Subjective identification: Unlike rigid patterns, rounding tops can be interpreted differently by traders, leading to inconsistent analysis.
- Unreliable on lower timeframes: On very short timeframes (M1, M5, M15), market noise and volatility reduce reliability and increase false signals.
- Capital-intensive for long holds: Because the pattern plays out slowly, traders may need sufficient capital and margin flexibility to hold positions for extended periods.
Conclusion
The rounding top pattern is a reminder that markets don't always reverse violently. Sometimes, trends end quietly, through hesitation, fading momentum, and slow distribution.
For traders willing to wait for confirmation, the rounding top offers a clean framework for identifying bearish reversals with defined risk and logical trade structure. The key is patience. Let the pattern complete, respect the breakdown, and manage risk carefully.
When combined with volume analysis, trend context, and disciplined execution, the rounding top can become a valuable addition to any trader's price-action toolkit.
Read More: How to Identify and Trade the Adam and Eve Pattern
Frequently Asked Questions
Is the rounding top pattern bearish or bullish?
The rounding top is a bearish reversal pattern that signals a potential shift from an uptrend to a downtrend.
Is the Rounding Top Pattern Reliable?
The rounding top can be a reliable trading pattern when used correctly. It performs best when: (1) It forms after a mature, extended uptrend, (2) Volume confirms the breakdown below support, (3) It aligns with broader market conditions and trend context. However, it should never be traded in isolation.
How long does a rounding top pattern take to form?
It often forms over weeks or months, making it more common on higher timeframes.
Can the rounding top pattern fail?
Yes. False breakdowns can occur, especially if volume is weak or the broader trend remains strong.
Is the rounding top good for day trading?
It's better suited for swing trading and position trading due to its slow formation.
What timeframe works best for rounding top patterns?
Daily and weekly charts tend to produce the most reliable signals.
Follow Us On Social Media